Code profiling is one of the most important parts of the code optimisation process. Generally speaking, it is the program analysis where we are mainly interested in memory usage and time complexity of the program (or each of its parts). We can also be interested in how often we use some function (or how often we call it, what is the latency). There are a lot of principles and tools to perform these tasks. This article is mainly focused on stack tracing, line-by-line code analysis tools, and function call graphs.
Stack trace (aka stack backtrace or backtrace) sampling
Stack trace sampling represents one of the fundamental principles of program profiling. The basic principle is that the algorithm sample program's stack (stack trace) in some reasonable frequency. In the end, we can analyse the running time of each block and its memory usage.
Consider the following code (which is massively ineffective):
def c(input):
    out = 0
    for i in range(4000):
        out += i * 7 * input
    return out


def b(input):
    out = 0
    for i in range(4000):
        out += i * 5 * input
    out += 5 * c(input)
    return out


def a(input):
    out = 0
    for i in range(8000):
        out += i * 3
    out += i * 3 * b(input)
    return out
A simplified stack of the program (that calls the function 'a') would follow the logic:
[() <- beginning of the code]
[(a) <- function 'a' is called]
[(a, b) <- function 'a' call the function 'b']
[(a, b, c) <- function 'b' call the function 'c']
[(a, b) <- function 'c' returns the result to 'b']
[(a) <- function 'b' returns the result to 'a']
[() <- function 'a' returns a result]
This stack is simplified because there are also many other sub-operations (arithmetic operators, print statements, loops, etc.), but it captures the main purpose of the stack.
Visualisation of the stack trace sampling (for running time)
If we are interested in performance optimisation, we need to see the time consumption of each block. The figure typically looks like this:

There is a time on the horizontal axis and the stack depth on the vertical one (in this case, going down) in this figure.
How to plot figures like this in Python (cProfile, snakeviz, vprof)
Python has a built-in profiler called cProfile. This profiler documents the running time of each block in the program (alas, not the memory usage). It can be called directly using the command:
python -m cProfile -o {OUTPUT}.dat {PROGRAM}.py
where the {OUTPUT} should be replaced by the path to the output data file and the {PROGAM} is the script that is the subject of the profiling.
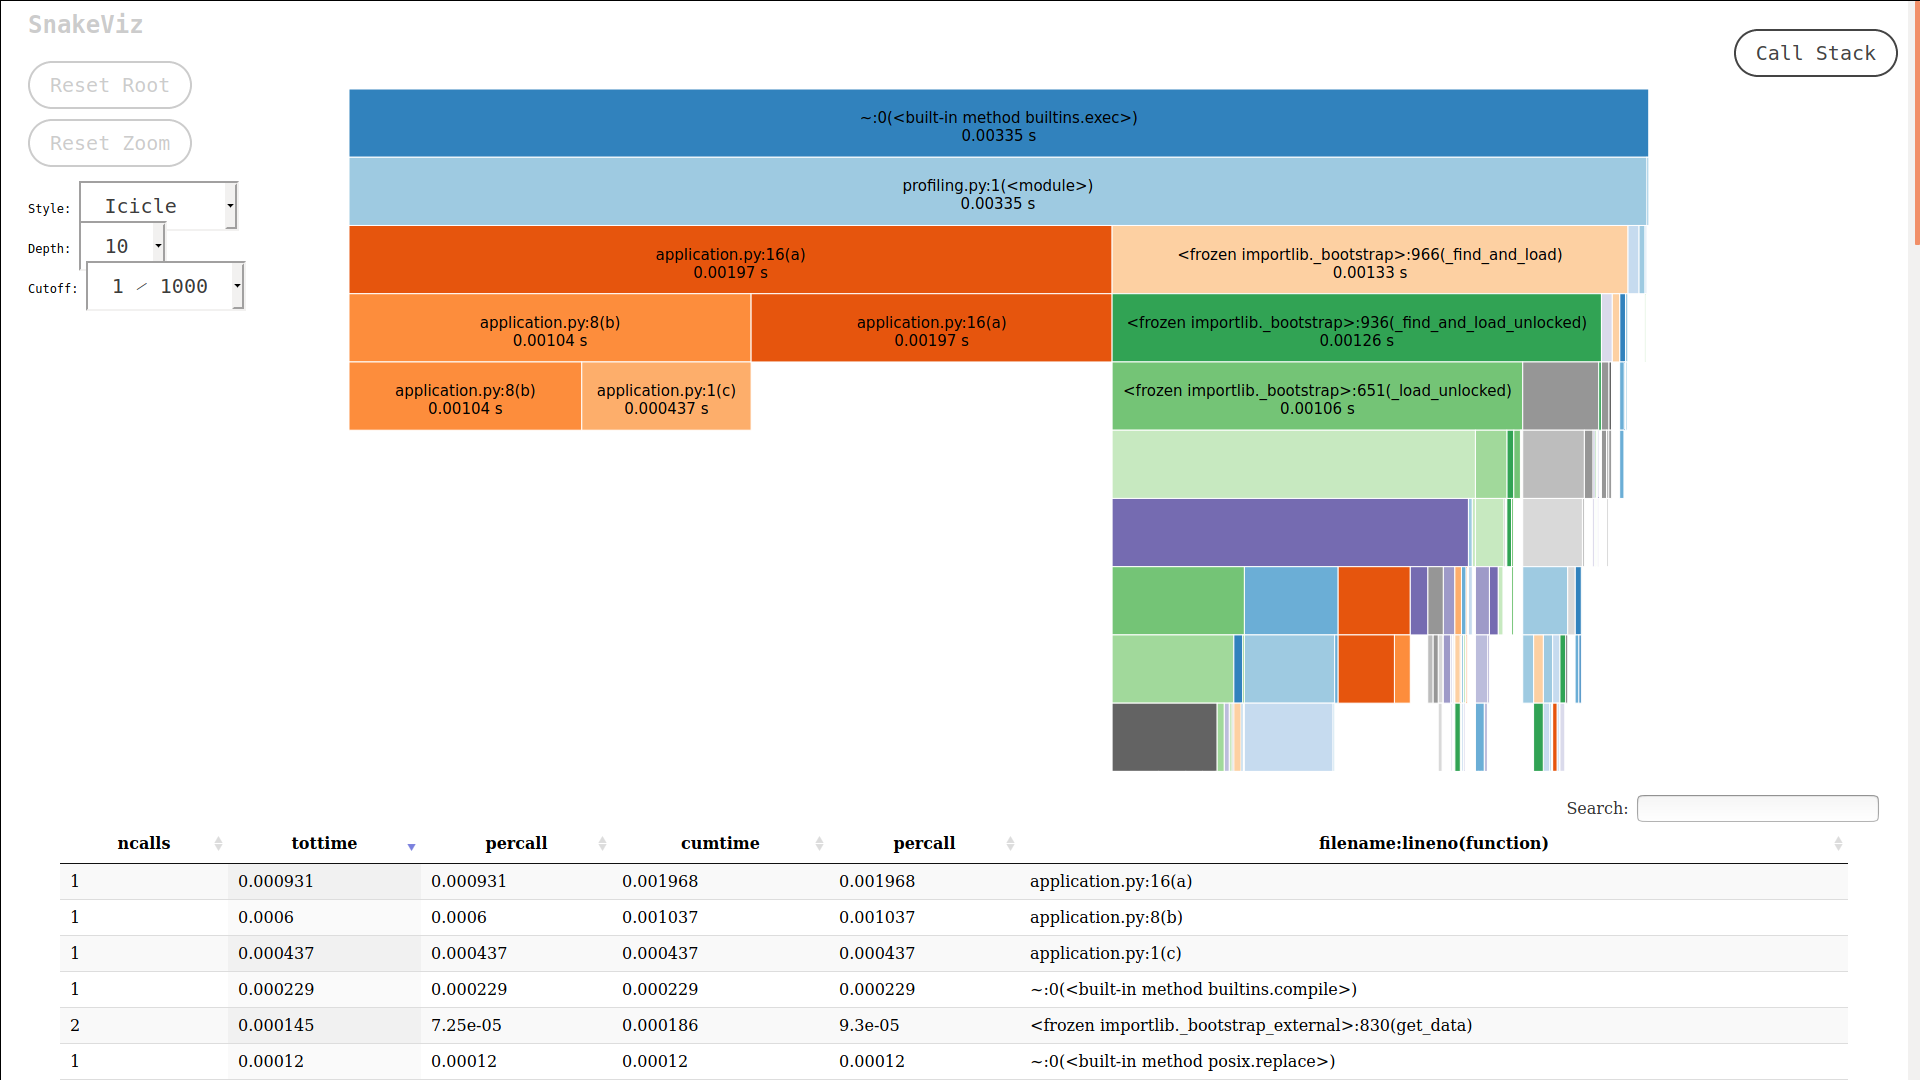
There are many tools for the visualisation of the outputs. Arguably the most popular one is called snakeviz. It can be installed using pip (pip install snakeviz). It is a web application visualising the profiler output (received by cProfile) as an interactive graph. To call the SnakeViz, use simply the command:
snakeviz {OUTPUT}.datOutput window of the SnakeViz looks like this:

Another very popular tool that does the same is called vprof. It can be again installed using pip (pip install vprof) and called using logic:
vprof -c cmh "{PROGRAM}.py"What do we want to achieve?
Our main objective during the optimisation process is to shrink all the blocks as much as possible. Optimally in both dimensions (not to have too many sub-procedures called, and have the shortest running time for each).
Memory stack trace sampling
There is currently no equivalent tool in Python for visualisation of memory usage in the stack trace sampling logic when it comes to memory profiling. The only option is to use the line-by-line analysis. Closest to this is the package guppy3 presented below.
Line-by-line analysis
This type of analysis is a kind of cavemen approach. We basically measure each line's memory usage and running time in our code. In this case, one must be aware of the impact that measuring itself has on the measured data (line-by-line analysis is susceptible). The output of memory profiling is typically just a table containing line numbers and matching values.
Line #    Mem usage    Increment   Line Contents
================================================
     5     14.3 MiB     14.3 MiB   @memory_profiler.profile
     6                             def profiled_fn():
     7     14.3 MiB      0.0 MiB       a(9)
Memory profiling in Python (package memory-profiler)
The output of line-by-line memory profiling is the vector that contains the value of used memory for each line of measured code. In Python, a library called memory-profiler can be easily installed by pip (pip install memory-profiler). The simplest model is to profile concrete function using the decorator "profile":
import memory_profiler

from application import a

@memory_profiler.profile
def profiled_fn():
    a(9)


if __name__ == '__main__':
    profiled_fn()
The output of this profiling is in the table shown above.
Slightly more complex usage of the memory-profiler (usable for further processing) is to use the method "memory_usage":
import memory_profiler

from application import a, b, c


def measured_function(arg):
    print(a(arg))
    print(b(arg))
    print(c(arg))


# Measure the memory usage
mem_usage: list = memory_profiler.memory_usage((measured_function, (5, )))
This function returns an array containing each line's memory usage (indexed from 0). Using the memory_usage function is incredibly helpful for analysing the code memory requirements for different inputs.
It is good to know that Python requires some mandatory memory usage of about 100 MB (this has to be considered a constant). Memory usage accepts two parameters, one is the pointer to the function, and another one is the tuple of arguments.
Visualisation of the line-by-line memory profiling in Python
After receiving the vector with values, you can use all standard approaches for plotting graphs in Python (like pyplot). Slightly more complex visualisation is available in the vprof (described above). If you choose to use vprof, you, unfortunately, cannot scale the problem by any argument (it just shows you the memory consumption line by line of script that you have called).
Package guppy3 for advanced memory profiling
Package guppy3 (installable via PIP: pip install guppy3) represents a slightly more sophisticated approach for analysing the program memory usage. It shows a more in-depth analysis of the heap state, including the objects' data types (unfortunately, only the basic type are reflected). You can as well use the complex API to access all measured values. To use guppy3, follow the logic:
import guppy

from application import a, b

# Do some logic
a(9)
# Create a point for the analysis
point_0 = guppy.hpy()
# Do different logic
b(7)
# Creates another point:
point_1 = guppy.hpy()

# Print the analysis
print(point_0.heap())
print(point_1.heap())
where point_0 = hpy() creates a point where the analysis of the heap is committed. For printing the analysis, you can call the function point_0.heap() on the object (or you can use deeper analysis tools described in the documentation on GitHub). Typical output looks like this:
Partition of a set of 39738 objects. Total size = 4574417 bytes.
 Index  Count   %     Size   % Cumulative  % Kind (class / dict of class)
     0  10694  27   976147  21    976147  21 str
     1   9808  25   718032  16   1694179  37 tuple
     2    557   1   456456  10   2150635  47 type
     3   2441   6   352832   8   2503467  55 types.CodeType
     4   4854  12   336978   7   2840445  62 bytes
     5   2304   6   313344   7   3153789  69 function
     6    557   1   268024   6   3421813  75 dict of type
     7    248   1   184800   4   3606613  79 dict (no owner)
     8     99   0   183152   4   3789765  83 dict of module
     9    288   1    96256   2   3886021  85 set
<115 more rows. Type e.g. '_.more' to view.>
As you can see, guppy3 covers everything available in the memory_profile package plus offers slightly deeper inside.
Function dynamic call graphs
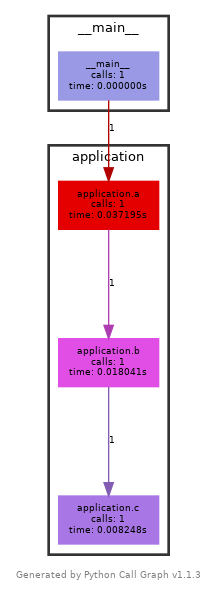
A call graph (aka call multigraph) shows the flow of the application. Basically, it visualises what each function call based on a given input. It is an incredibly helpful tool for simplifying the code (reducing the number of function calls). The typical flow looks like this:

Creating the call graph figure in Python
Although it seems to be a trivial task (which it surprisingly is not), there are no robust tools that can create a call graph. The package closest to this goal is pycallgraph2 (pip install pycallgraph2). However, to make it work, it also requires a system package called graphviz (on Debian installable via apt install graphviz).
To create the graph, you need to commit:
pycallgraph graphviz -- {PROGRAM}.pyThe script generates the PNG file (pycallgraph.png) that looks like the graph illustrated in the figure above. Another way to use pycallgraph is to use it inside the source code.
from pycallgraph2 import PyCallGraph

from pycallgraph2.output import GraphvizOutput

from application import a

with PyCallGraph(output=GraphvizOutput()):
    # Code to profile:
    a(9)
Real problems are typically so complicated that generated figure is not easily readable (generated objects are massive). The script is also very susceptible and cannot handle many useful things (multithreading and multitasking, many external libraries, etc.).
Other types of profiling
So far, only a generic type of code profiling has been discussed. However, there might be other essential metrics depending on the application type. One of the common things for web application is to measure the number of database hits - meaning how many times does application access the database server for a specific request (or set of requests). This information is important because every request is delayed by latency when accessing the database server. Similar essential matric is the number of input and output operations on disk (or through the network) - for the same reason (each IO operation has its latency). This matric can be measured using presented tools (focusing on IO operation calls). There always is a trade-off between reading or writing more but less often versus the opposite.
Summary
There are many similar tools for code profiling. It is, however, always good to bear in mind that measuring itself changes a code behaviour (always true). This article summarises some essential tools available in Python for code profiling. The performance (run time) profiling is cProfile + snakeviz or vprof. The profiling of memory usage is the package memory-profiler and guppy3. When it comes to the dynamic call graphs, it is mainly the package pycallgraph2. All presented packages are available through PIP (the pycallgraph2 also requires one system package).
Related GIT repo
All used source codes are available in the REPO: GIT repo
See the guppy3 documentation on GitHub
❋ Tags: Data Visualisation Profiling Python Design Performance